A fitness landscape is a mapping from a combination of trait values to a fitness. They are generally visualized so as to make it clear which trait values are closer to each other (i.e. easier to mutate between). Traditionally, for the purposes of easy visualization, they are drawn in three dimensions (x, y, and z axes). The x and y axes each represent a trait (i.e. a property that an individual might have). The value on the z axis represents the fitness of an individual possessing a given combination of trait value. This approach creates an intuitive topographical visualization, where we expect to see populations climb “hills” in fitness space over time. Most real world fitness landscapes, however, have *many* more dimensions.

The following two videos may be helpful for a more detailed introduction:
Approaches to visualizing fitness landscapes
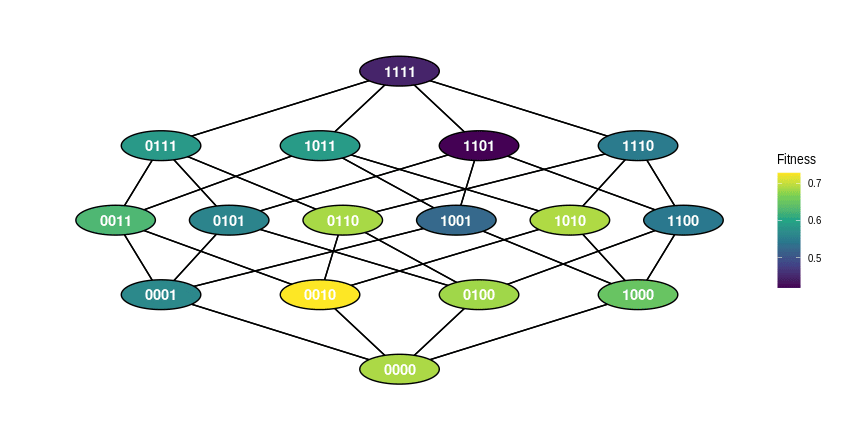
While the topological visualization discussed above is effective for landscapes with one or two non-fitness dimensions, it presents a challenge for higher-dimensional landscapes (such as most real-world fitness landscapes). One common approach is to use a graph instead. Each genotype is represented as a node, and mutational-adjacency of genotypes is represented with edges between nodes. While this representation is powerful, in many cases the graph can become a tangled mess that is hard to gain intuition from. Making intelligent choices about how to position nodes can help with this problem, as can having a relatively small or intuitively structured landscape.
For example, it is relatively common in evolutionary medicine to represent fitness landscapes for the presence/absence of 4 genes (leading to 16 possible genotypes) in the “tesseract” layout below :


Critiques of fitness landscapes
There is widespread concern that intuitions based on the low-dimensional representations of fitness landscapes that must necessarily be used in most visualizations may not translate accurately to realistically sized landscapes. As dimensions are added to a space, properties of that space such as connectivity may change in a systematic way. Thus, some have speculated that concepts such as “valley crossing” (i.e. the evolutionary difficulty of reaching one local optimum from a different one) may not be relevant in most real-world fitness landscapes.
